Microsoft Dynamics 365 Business Central has some great built-in reporting capabilities. One of my favorites is Analysis Views by Dimension. The beauty of this feature is that you can create multiple analysis views and slice and dice the data any way you want. It is like a mini report writer.
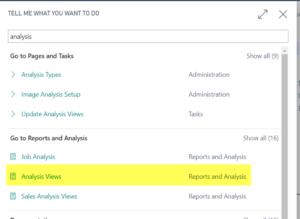
Setting up analysis views is simple. Type “analysis views” in the main search bar of Business Central. Go to the Analysis Views link and click on “+New.”

You will now see the following popup box for an Analysis View card:
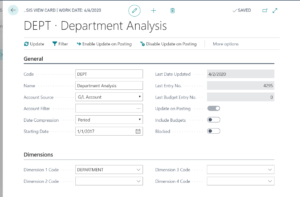
Here is a breakdown of the fields you see under the General section:
• Code: This is a one-word shortcut for your Analysis View.
• Name: This is the full name you want for your view.
• Account Source: You can choose either your G/L Account or your Cash Flow Account.
• Account Filter: From within that main account source, you can now choose which specific account(s) you want to be included in the report.
• Date Compression: Options include Month, Period, etc.
• Starting Date: This is the first date from which results can be pulled.
• Update on Posting: Enabling this features ensures that the data is always up-to-date. In most cases you will want to do this, but you can turn it off if you want to limit your view to specific data.
• Include Budgets: This is an option only if your Account Source is the G/L Account. This feature allows you to compare your budget to your actuals.
• Blocked: Enabling this feature prevents other users from seeing this view.
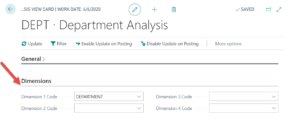
Now you can choose which dimensions you want included in the view. The system allows for four main dimensions in the Dimensions tab. Choose the correct dimensions from the dropdowns. Below you can see I chose only Department, but you can choose multiple dimensions depending upon your setup. NOTE: If you don’t yet have Dimensions set up in Dynamics 365 Business Central, you need to do that step first so they can be chosen here.
 Once you have completed setting up your view, you can view the data either through the Analysis Matrix or the Analysis Report.
To view the Analysis Matrix, simply type “analysis views” in the main search bar. On the list of Analysis Views that appears, highlight the view you want and choose Analysis by Dimensions along the top ribbon.

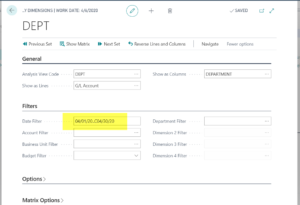
On the next page, choose Show Matrix. In addition, you can adjust the Lines and Columns settings as needed to view the matrix how you wish. As you can see below, I changed the Columns to Department and the Lines to GL Account before opening the matrix.

You can also add a data filter, including as many filters as you wish. Both the Options and Matrix Options tabs allow for even more filtering. I will not go into detail here, but you can use the built-in Dynamics 365 Business Central “Help” section to get more information on those options and the power behind them.
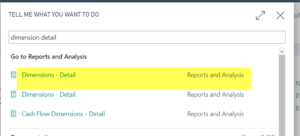
To view the Analysis Report (instead of the Matrix), type “Dimensions – Detail” in the main search bar.
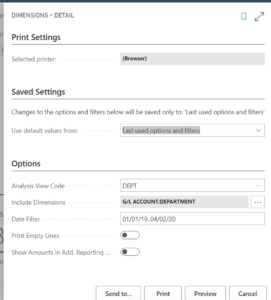
The following page will appear. Choose the Analysis View Code that you want to see.
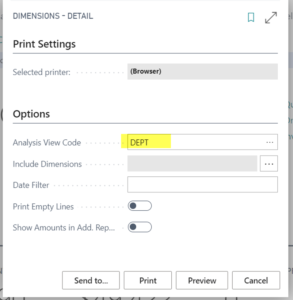
Click the three dots next to the Include Dimensions field. This will prompt you to determine the hierarchy of the reporting. In the example below, I determined that GL Account would be the top level and Department would be a level under that.

Enter a Date filter then select either Preview or Print.
