
Inventory analysis reports in Business Central are a newer functionality that gives Microsoft Dynamics 365 Business Central users greater insights into key inventory reporting metrics for their business. This functionality:
- Provides businesses advanced inventory reporting capabilities.
- Is a built-in standard reporting tool within Business Central (no extension required).
- Is the inventory equivalent of account schedules.
- Provides a seamless reporting output of sales, costing, and pricing data from your inventory subledger.
In this blog, I’ll explain how to set up and use inventory analysis reports, as well as how to push the data to and from Excel.
How to Create an Inventory Analysis Report in Business Central
Decide what you want to analyze. You can analyze multiple aspects of your inventory and sales costing, such as:
- Total inventory adjustments over a given period,
- Total inventory cost amounts over a given period, or
- Inventory sales amounts compared over different periods.
For this example, I will walk through how to generate a year-to-year inventory sales comparison between 2023 and 2024. Here are the steps:
- Search for “Inventory Analysis Column Templates” within Business Central.
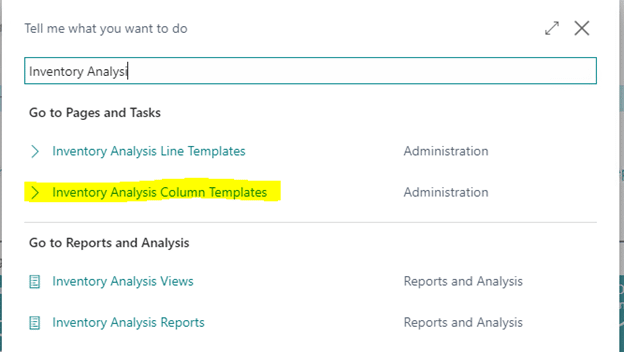
- Create a new inventory analysis column template record.

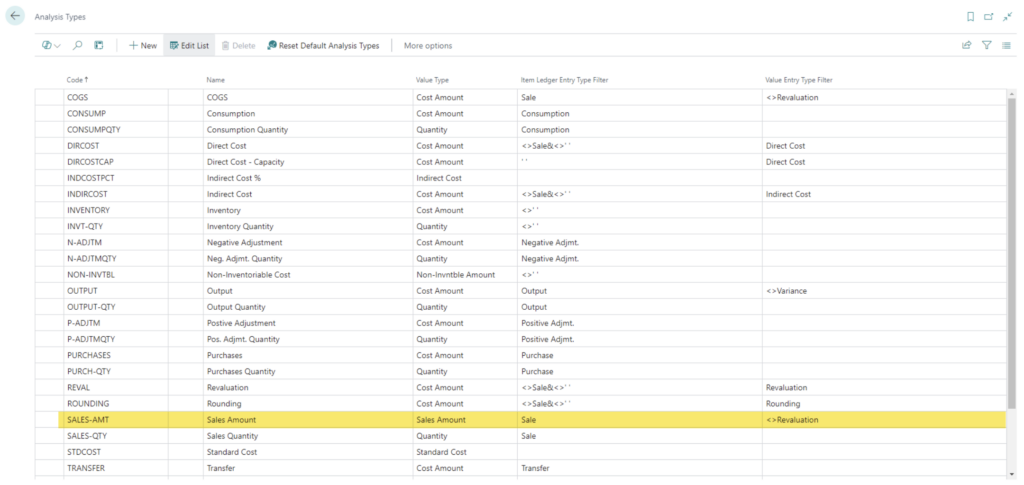
- Generate columns for your inventory analysis report. Give each column a number, header, and unique description. Those will appear in your reporting later. You can also create comparison period formulas here to analyze net changes and balances at dates with inventory subledger transactions. You also need to select an analysis type code as part of each column. There are a few default analysis type codes based on the inventory subledger that you can use and modify to build the analysis columns. In this example I used a default analysis type code for sales amount to create our inventory analysis report in Business Central.

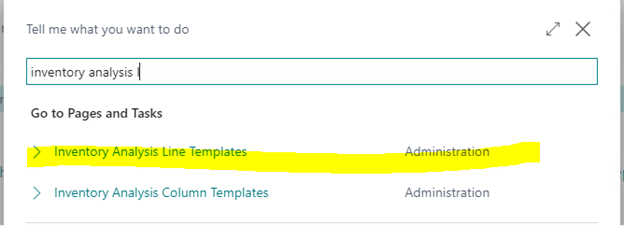
- Set up your inventory analysis lines. Search for “Inventory Analysis” and select the line templates page.
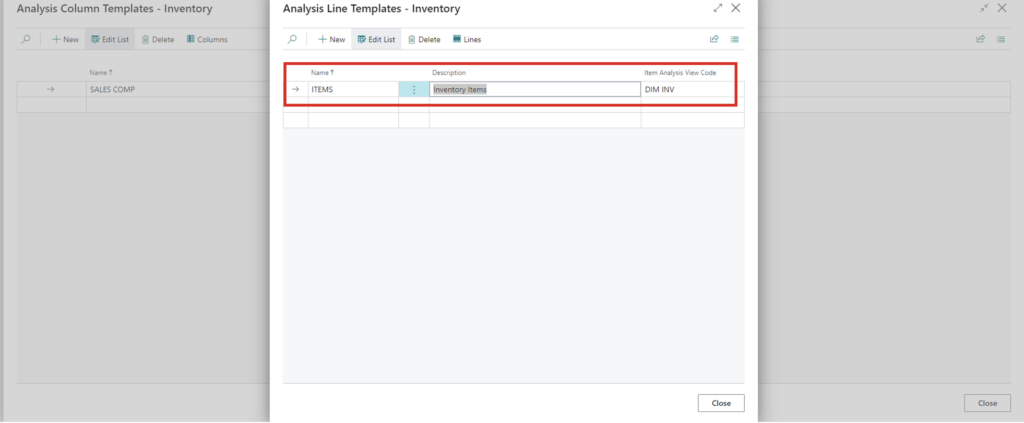
- Define a name and description for your line template as well as an analysis view. (I’ll explain the setup for analysis view in the next section.)
- Set up your inventory analysis view code by searching for it in Business Central.
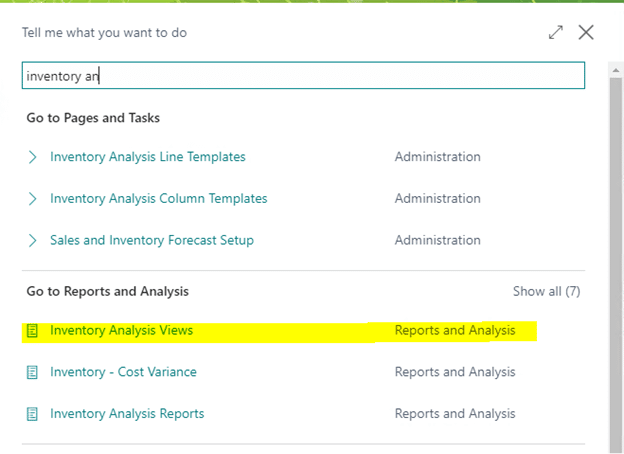
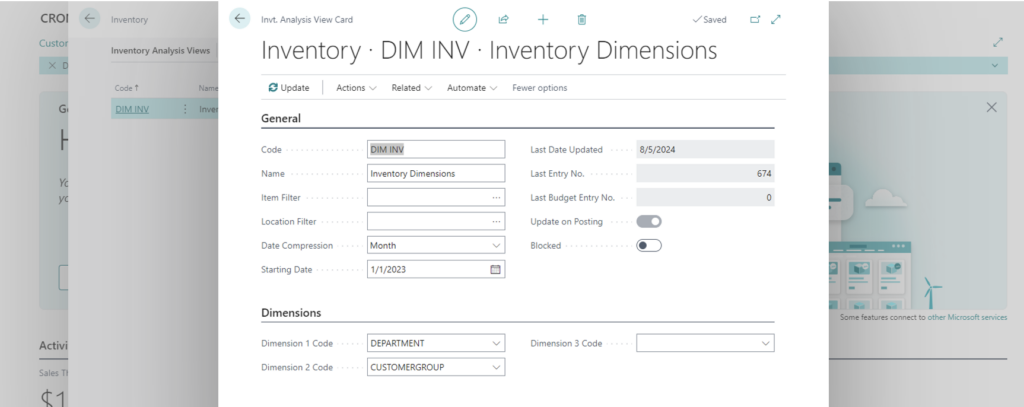
- Update your analysis view to pull the most recent inventory subledger information based on the dimensions and the date ranges you wish to track.
- Create a new analysis view card and populate the dimensions to track within the inventory subledger as well as the lines and columns of your view.
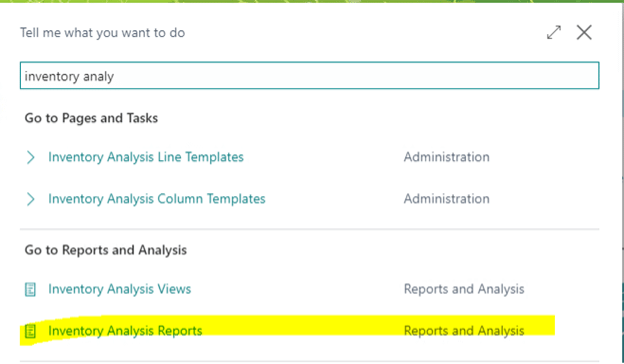
- Now it’s time to generate your report! Search for “Inventory Analysis Reports” in Business Central.
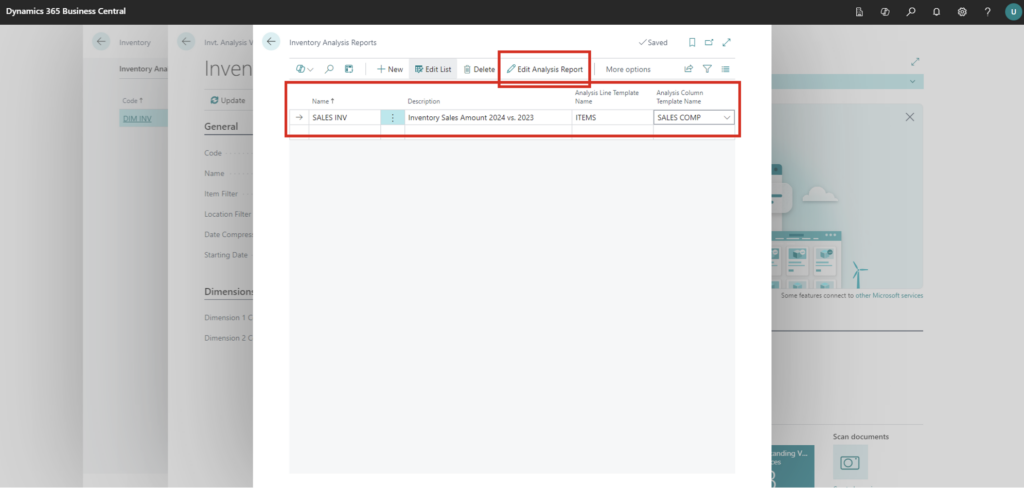
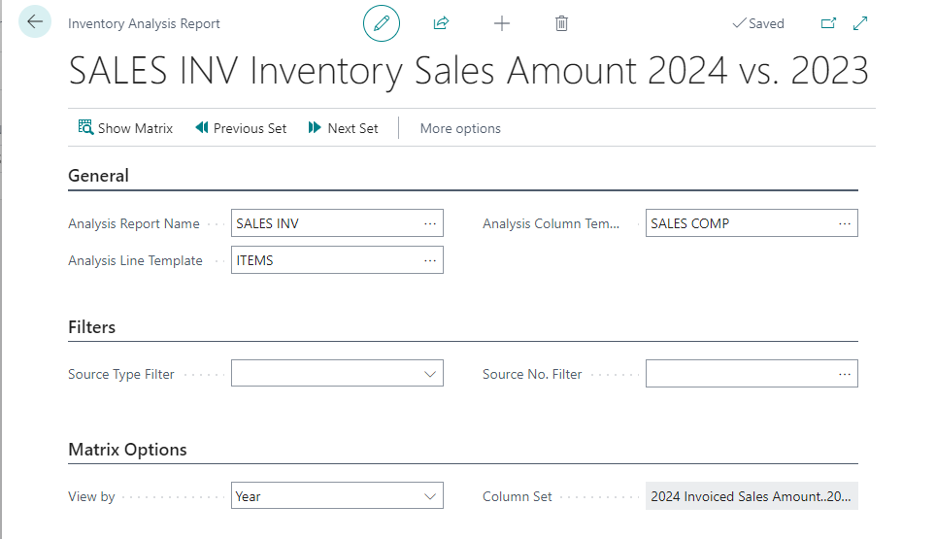
- Populate your inventory analysis report name and description and select the analysis line template and analysis column template that you set up in the previous steps. Once you’re done, select “Edit Analysis Report” on the ribbon.
- Select “Show Matrix” on the Inventory Analysis Report page to generate the matrix report output within Business Central.
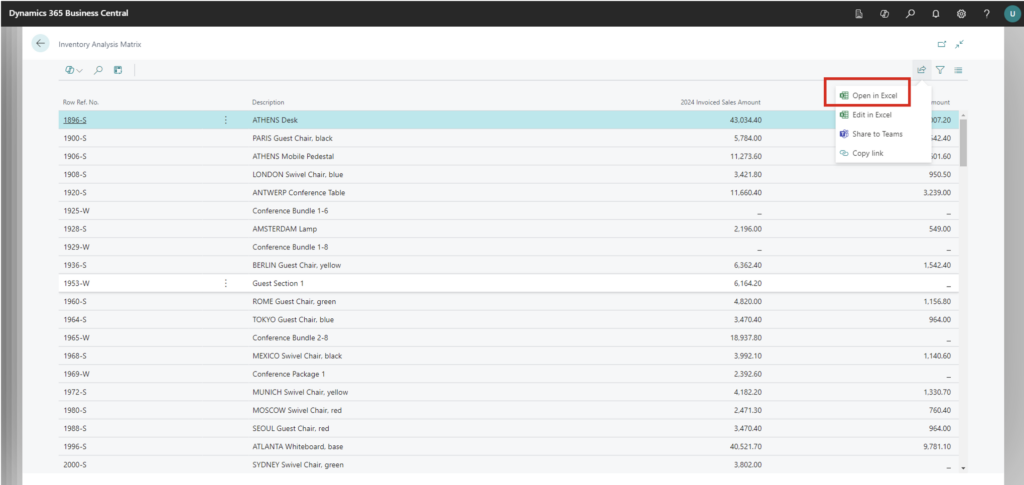
- Select “Open in Excel” once the matrix is displayed to export the report results to Excel.
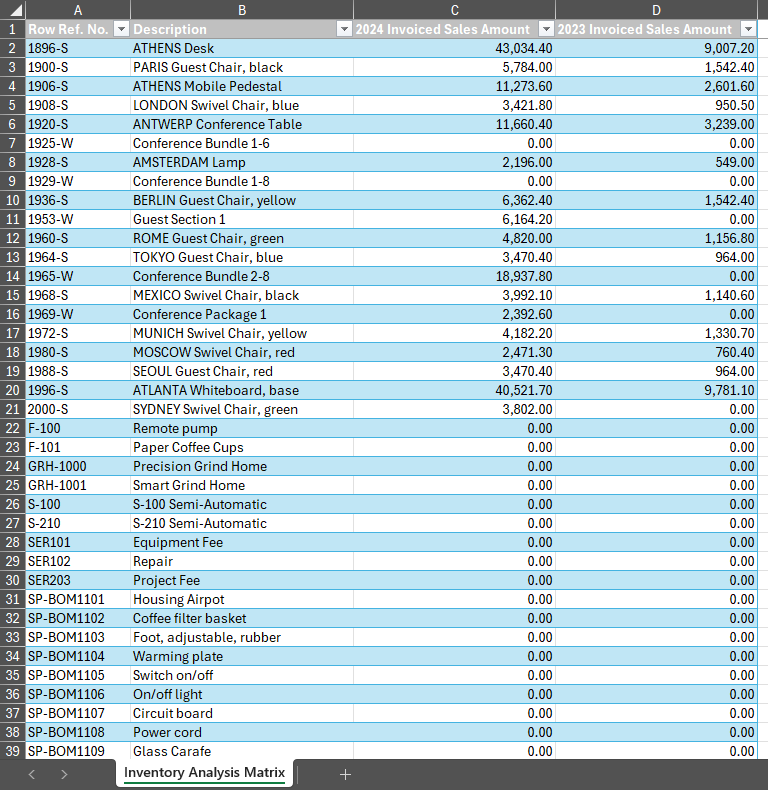
- The Excel matrix inventory report output is now exported as an Excel file.
FAQs on Inventory Analysis Reports
Q: What if I want another way to get an Excel report from my inventory analysis report?
A: No problem. Select “Create New Document,” and that will generate a new Excel workbook file.
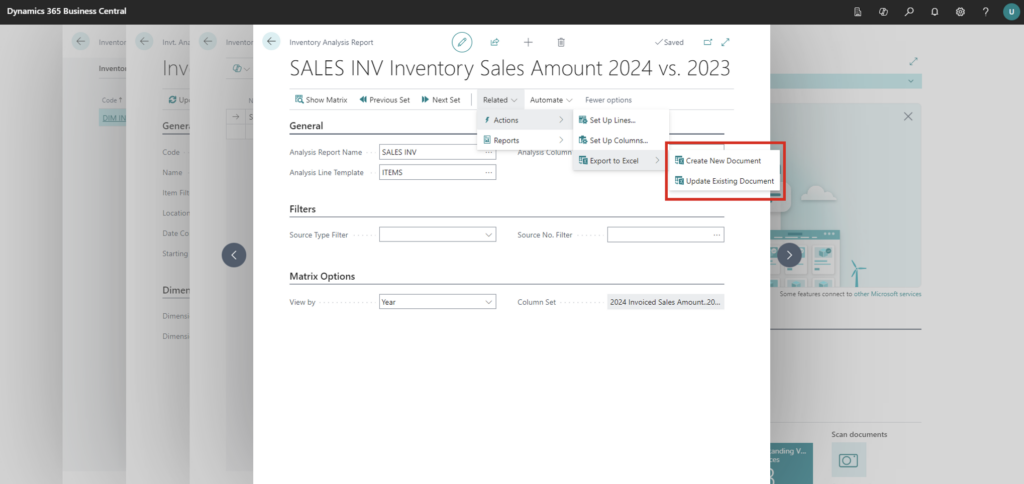
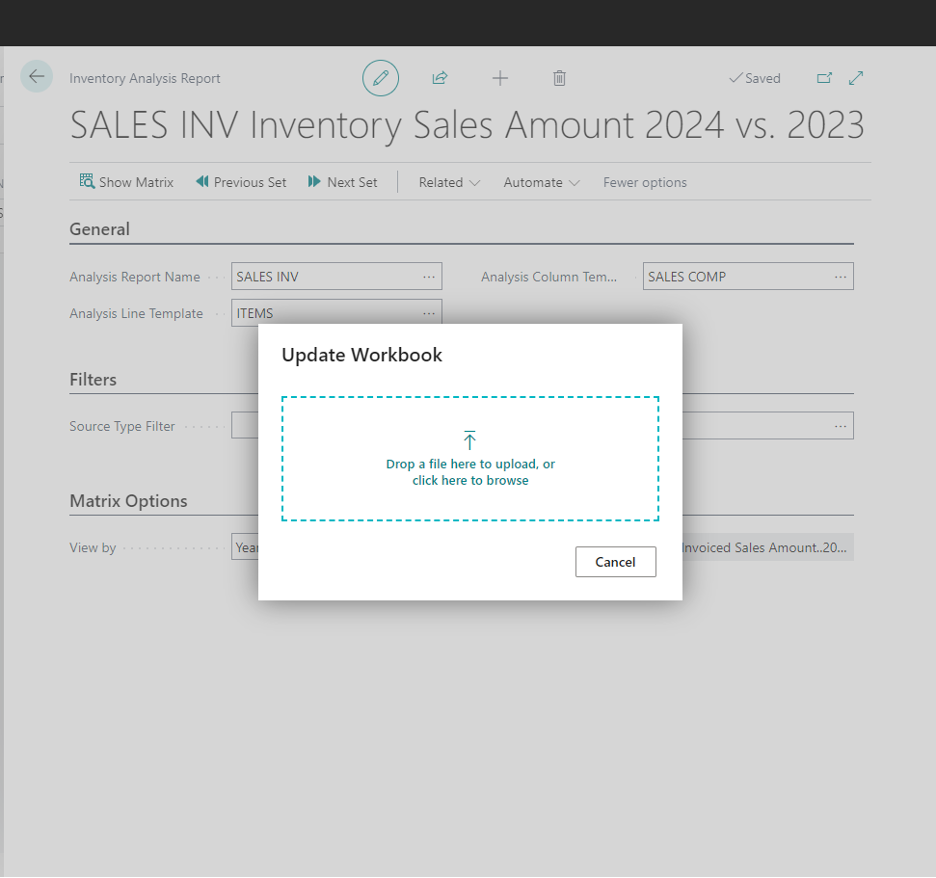
You can also update an existing Excel document by selecting “Update Existing Document.” From there, select the document from your desktop by clicking the “Drop a file” button.
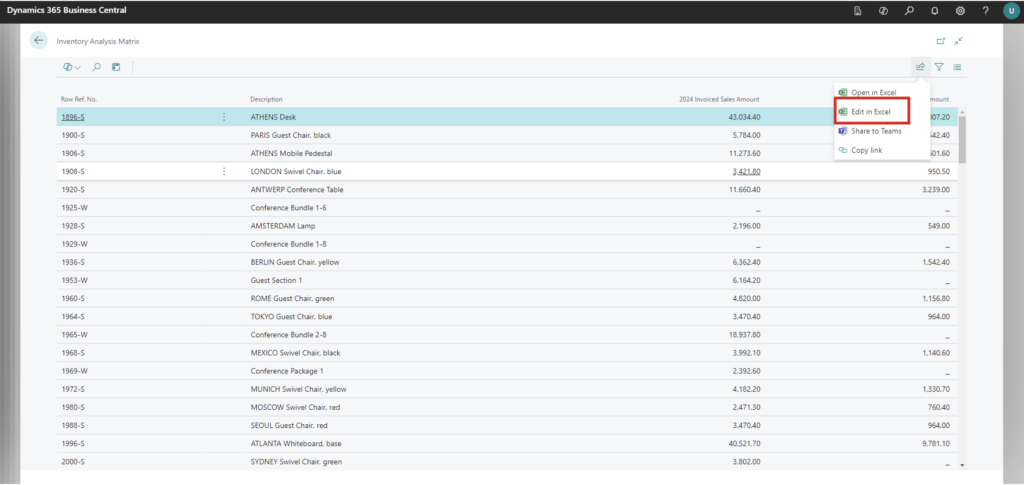
Q: How can I publish my data from Excel back into Business Central?
A: Just select “Edit in Excel” on your Inventory Analysis matrix view to get a dynamic Excel file that you can publish back into Business Central.
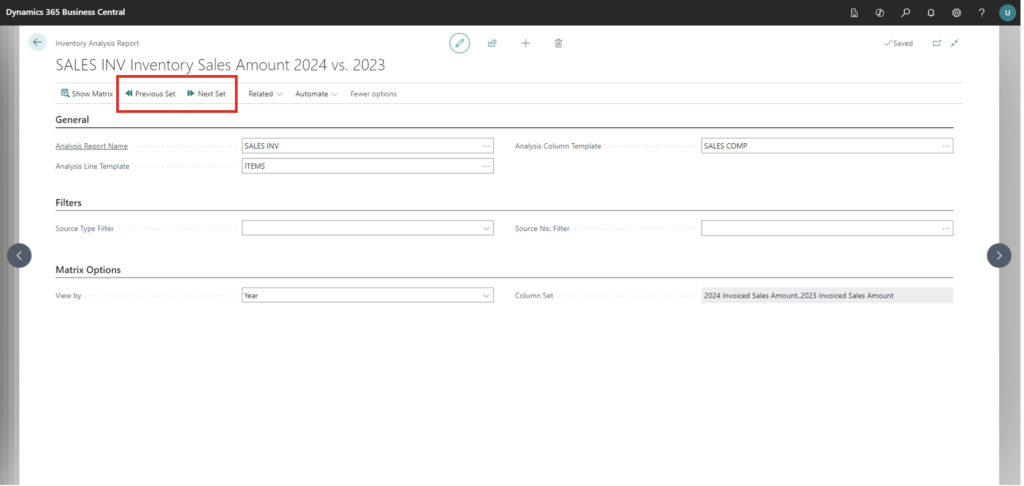
Q: How do I change the date range I want to export in my inventory analysis view?
A: No problem. Just change the column set by selecting “Previous Set” or “Next Set” in the matrix option view range.
Happy inventory report building!


