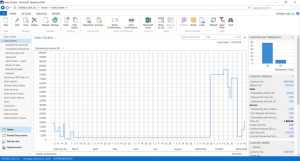
Charts in Microsoft Dynamics NAV can serve as great first-glance tools for key activities in your business such as year-to-date sales, open invoices, sales by salesperson and so on.
Many charts are already imbedded in NAV, but did you know that you can change them or add more to your role center? Did you know that you can add charts as FactBoxes on list pages?
Here’s how:
While in your Role Center, go to the Applications menu (blue button with a drop-down in the upper left-hand corner).
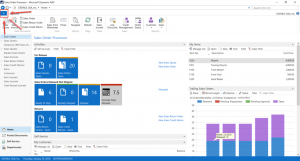
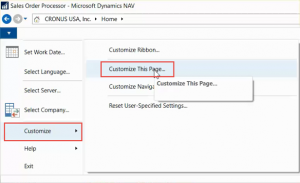
Select “Customize,” then “Customize This Page.”
Highlight “Chart Part” in the Available Parts column and then click on the “Add” button. A Blank Chart box will appear in the Role Center Layout. Click the “Customize Part” button.
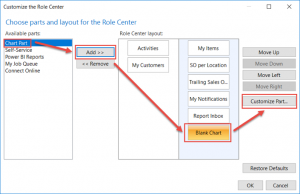
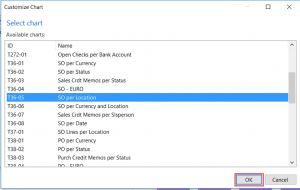
You will then be able to choose from a list of pre-configured charts. Once you’ve made a selection, click “OK.” In this example, we’ll choose sales order per location:
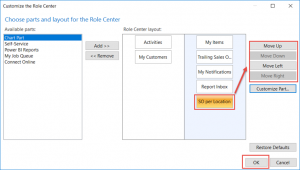
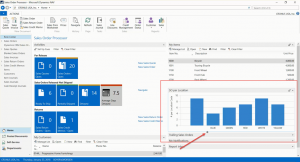
Change the positioning of the chart on the Role Center by moving the chart box up, down, left or right. Then select “OK” and the chart will appear on your Role Center.
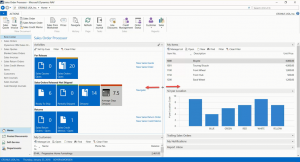
To resize the information on the Role Center, hover your mouse over the edges of any of the information boxes and drag the cursor.
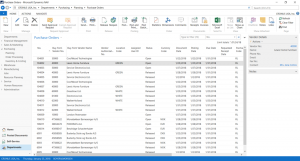
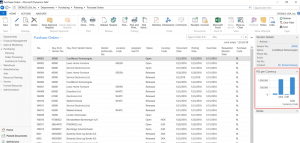
List pages can also have charts added to them in the FactBox area. Navigate to the list page where you would like to add a chart. For our example, we’ll go to the Purchase Order list view.
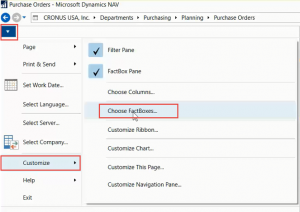
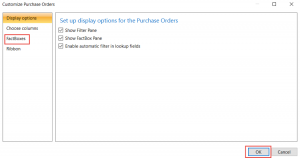
Choose the Applications menu, Customize, and then Choose FactBoxes and click “OK.”
Again, go through adding the Chart Part and selecting the chart you would like to add.
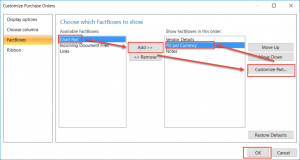
The chart will appear as a new FactBox:
Have you ever wondered how to successfully change a list view to a chart view? Next time I’ll show you how to get from this:
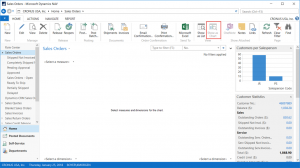
… to something like this:
